
Case studies

AI revenue optimisation for a multi‑location retail chain: +5.2% in a 10‑day pilot

AI revenue optimisation for a multi-location retail chain: +5.2% in a 10-day pilot
  • Geography Europe
  • IndustryRetail
  • ServicesAI revenue optimisation & forecasting

Intro

Years of customer data, and no way to turn it into revenue

Our client is a large consumer retail and leisure chain in Europe with dozens of locations and millions of visits a year. Every visit, purchase and booking left a data trail. Over the years that trail grew into a huge archive, but nobody was using it to make decisions.

The questions were very practical. Which offers actually bring customers back? Why are some hours packed while others stay half-empty? How do you personalise communication without guesswork? And how do you know an idea works before rolling it out across the whole network?

The client partnered with S-PRO to turn scattered customer data into a working AI system that tells managers what to offer, where and when, and how much revenue each decision is likely to bring.
5.2%+
revenue lift in a 10-day pilot
95%
confidence interval vs. control locations
5
optimisation iterations to beat the baseline

Challenges

Uneven demand, scattered data and decisions made by gut feeling

Peaks and dead hours
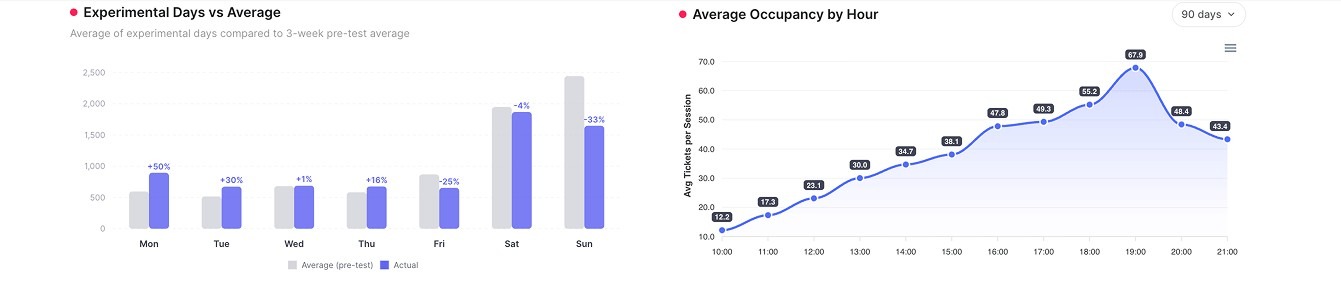
Evenings and weekends were at capacity, while weekday mornings and afternoons stayed underused. Capacity that is not sold in a given hour is lost forever.

Data that was never meant for analytics
It was the client’s first project of this kind. Years of transaction and visit data sat in different systems and formats and had to be collected, cleaned and connected before any model could learn from it.

A model managers would actually use
The result had to fit real business rules and daily operations, not live in a slide deck. Managers needed recommendations they could understand, adjust and trust.


Solution

S-PRO built an AI revenue optimisation agent based on customer segmentation and uplift modelling

Customer segmentation
We analysed customer behaviour and found distinct audience clusters: what each group buys, when it comes and how often it returns.

Uplift modelling
Using these insights, the agent models the plan for each location: which offer to put in which time slot, and how much additional revenue each combination is likely to generate compared with business as usual.

Targeted campaigns
The same segments power personalised marketing, so each customer group gets recommendations that match what they buy and when.

Human in the loop
Managers set the time window, the items to include and the constraints, then the agent builds the plan in one click. They can adjust any slot manually and ask the model to re-optimise around their changes.

Privacy by design
All customer data was processed under a data processing agreement and anonymised: personal identifiers were removed, so the system never works with individual profiles.

The agent is not tied to one industry. The same set-up works with any items, locations and limits: products and store slots in retail, SKUs and locations in a warehouse, lines and shifts in a factory.


Results

+5.2% revenue in a 10-day pilot, measured against twin control locations

Proven, not estimated
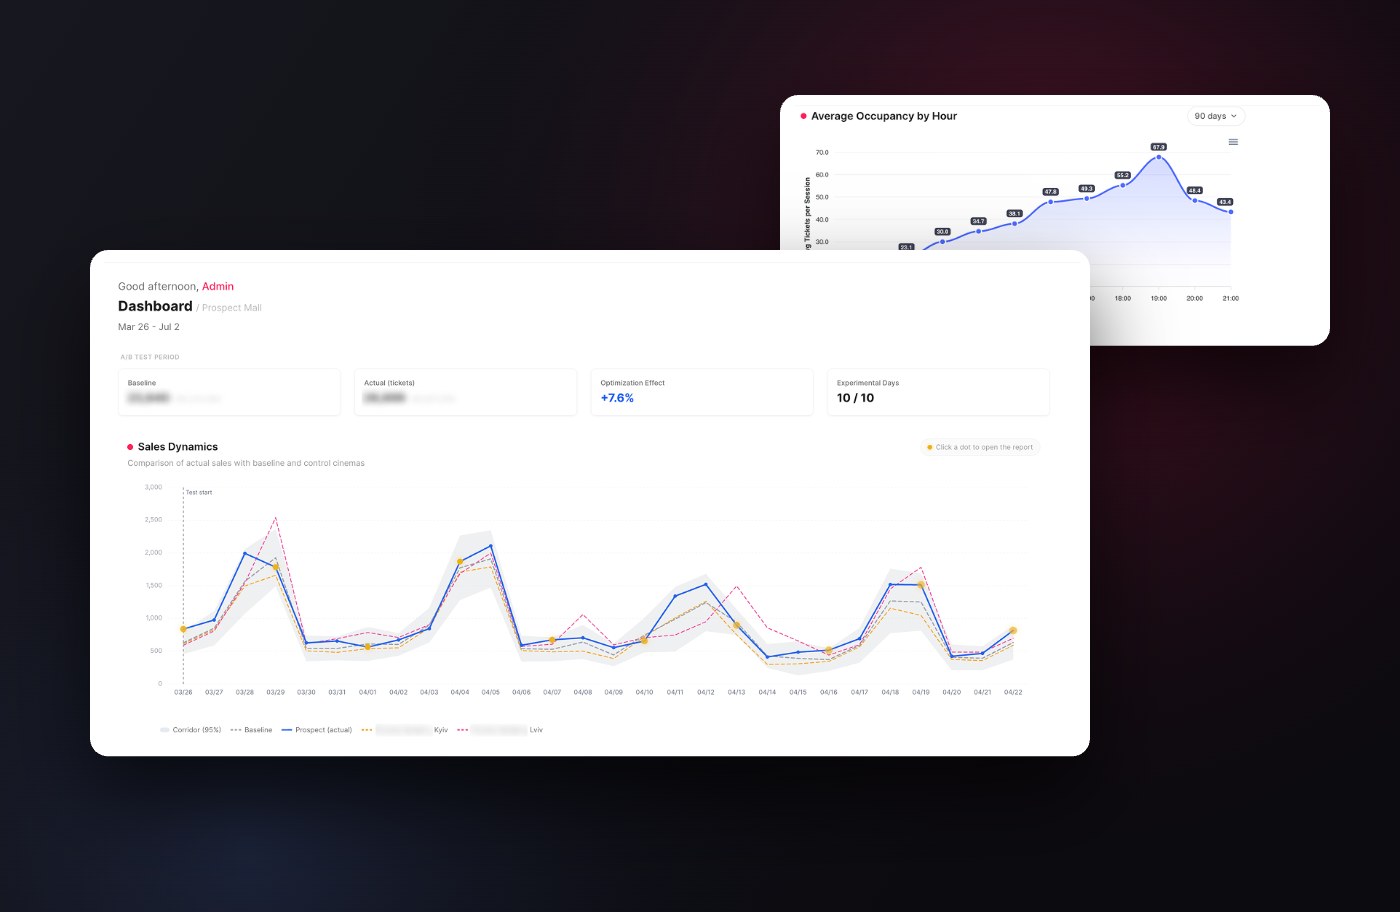
During a 10-day pilot, the test location achieved a revenue increase of more than 5.2% compared with similar locations in the same network. We validated the lift against “twin” control locations with comparable history and a 95% confidence interval, to make sure the growth came from the optimisation and not from chance or seasonality.

Quiet hours started to sell
While control locations followed their usual demand patterns, the optimised plan captured more demand in traditionally quiet time slots.

Getting better with every run
Read-outs track the agent against the client’s own baseline by day, hour and segment. Within five iterations it consistently outperformed the pre-test average.

The project is complete and the client uses the system in daily operations to forecast demand, plan offers across time slots and estimate revenue potential before making a decision.


Conclusion

From reporting the past to deciding the next step

The project showed that data can do more than describe what happened. Combined with the right model and real business rules, it can predict demand, recommend the next action and prove its impact with control groups.

Where this applies in financial services: the same uplift modelling and constraint-based optimisation can help banks and fintechs decide which product to offer to which segment, in which channel and at what time, plan branch and contact-centre capacity around demand peaks, and measure campaign impact against control groups, with the same privacy-first set-up.

Want to see what this could do with your data? Talk to our team.


Get in touch

Get in touch
Ready to discuss your project?
Share your ideas, findings, and questions with us. We’re excited to extend our expertise to your project. After form submission, we'll respond you within 24h.
R&D centers
Zurich, Switzerland (HQ)
Löwenstrasse 45, 8001
Lodz, Poland
Zachodnia 70, 90-403
Business representatives
Salt Lake City, USA
Kiln SLC, 26 S Rio Grande St, UT 84101
Austin, USA
11801 Domain blvd., 3rd Fl, Austin, TX 78758
Amsterdam, Netherlands
Gustav Mahlerplein 2, 1082 MD
Link copied to clipboard