

Do you have an already developed mobile app? Congrats! Have you thought through the way users will interact with it? Will they download, like, use and rate it? How can you even measure whether users are ready to stick with your app? To determine your app success first you want to choose certain metrics that will measure and analyze customer experience thus giving you a chance to formulate the best marketing strategy for your mobile application. Ready?
TOP 12 customer experience metrics for a mobile app marketing campaign
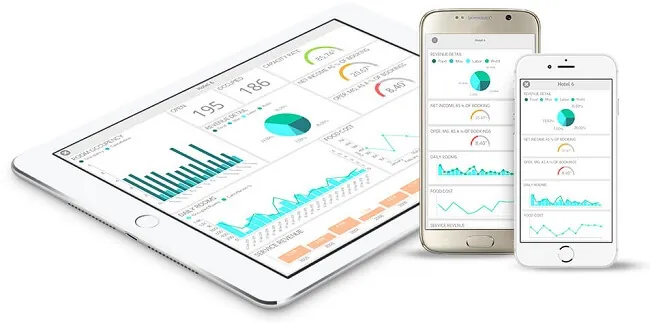
Key performance indicators (KPIs) are those metrics that aim at defining your business success by evaluating crucial factors. Ideally, they should be simple, easy-to-use for all team members, frequently measured to show the clearest picture and consistent with the established goals. Now let’s get to know the most useful and popular ones!
#1. Installs rate
The first 72 hours after launch are crucial for this metric. It determines the app’s rank on the Store in the long run. Surely, afterward, you should continue measuring not only the number of installs but also their sources.
Moreover, it is useful to calculate a certain average rate based on the app type, store you launch it on, competitors research or financial goals you set. This is how you evaluate the effectiveness of your marketing strategy.
To measure installs rate you can use different trackers. We’d recommend you to avoid those offered by ad networks as they are interested in selling you the most installs. Independent trackers will give you an actual picture, among them: Google Mobile App Analytics, AppsFlyer, or Adjust.com.
#2. The cost to acquire a customer (CAC)
User acquisition expresses a number of users who have downloaded and installed the app during a certain period of time. In its turn, CAC is the monetary cost of sales and marketing efforts divided by the number of acquired users in the same period of time.
Kissmetrics will come in handy when measuring these metrics.
#3. Life Time Value (LTV)
LTV is a very important metric that defines how much revenue each customer will generate on average while staying a customer of this particular product. It can be counted in many ways depending on the type of the app, its monetization channels, and some other factors.
Put it simply, if your app is subscription-based and you expect that an average customer will pay, let’s say $5 per month for 2 years, then that customer’s value is ($5*12 months*2 years) which equals $120 in total revenue.
There is a number of online LTV calculators like Customer Lifetime Value, CLV Calculator, Demand Metric, etc.
#4. Monthly active users
This metric gives a full range of information about your active users: their interests and behavior. Proper analysis of these data helps you to figure out on the future features, monetization strategies, marketing campaign, how to increase the user engagement and motivate leads to make a purchase.
#5. Store Ratings
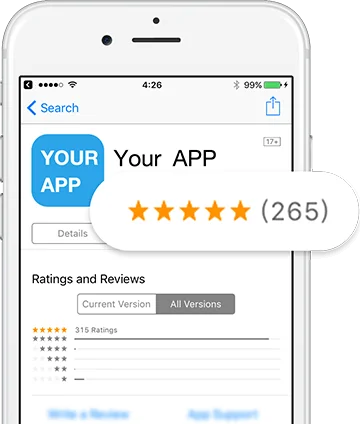
The easiest way to know your customer’s opinion about a product or services. But be sure to create an as best app as possible to protect your efforts from negative feedbacks that will ruin your hopes to get high rankings. Better to gather feedback at the testing period both of functionality and UI/UX.
#6. Session Tracking
Both session length and interval are important to receive insight on how long a user is active inside the app and how much time has passed between sessions. Knowing these parameters can help you determine the best time for showing them an add and thus making more revenue.
Also if users abandon an app for long it might mean that they face some bug or UI/functionality issues that need to be fixed. In-app feedback gives a deeper understanding of user preferences.
#7 Customer sentiment
Along with some Store and in-app feedbacks you can simply use Google alerts, social media channels or any other app mentions over the Internet to trace customer’s vision about your app and their likings. This metric is a great way to know more about the way users perceive and react emotionally towards your application.
#8. Demographics metric
This is a great way to identify your target audience knowing its gender, age, location, nationality, etc. People like when some product speaks to them personally and become loyal to it much easier. Once again personal-based ads will bring more revenue.
#9. Devices and OS
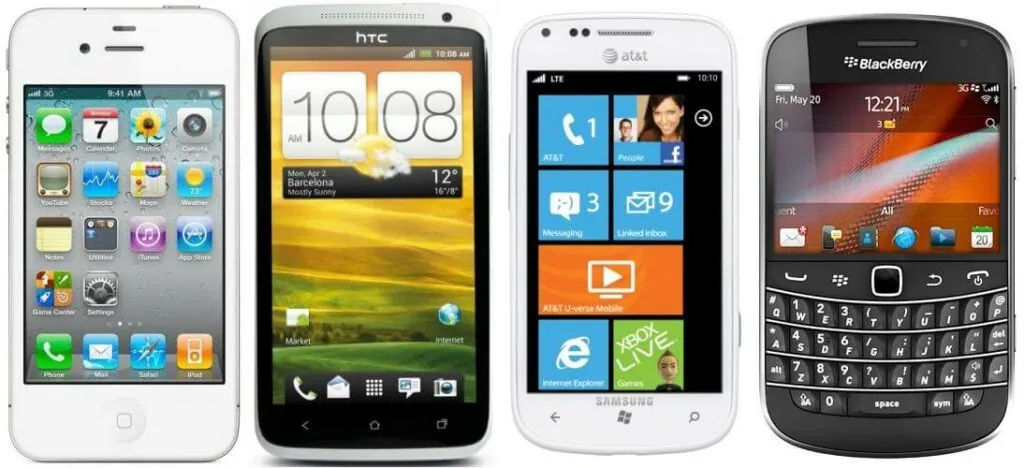
This metric can be tracked easily and gives you a vision of what features should be added for which devices/apps. As you will know not only the actual name of device and OS but their popularity among your users.
#10. Application crashes
Well, that happens. In around 1-2% on average, but do happens. A user will understand and accept it if that’s just a one-time thing. And what if it gets more regular? For sure, you are obliged to know the reasons for such situations and possible steps for users to overcome the issue. You wouldn’t like mass uninstalls, right?
#11. Recurring revenue
No one doubts that this metric is essential. This way you know how much money your users pay while using your app. Usually, two types of these metrics are calculated: annual (ARR) and monthly (MRR) recurring revenues.
The annual recurring revenue is money coming each year while a subscription lasts. For example, your user purchases a 3-year subscription for $1500 total, then ARR would be $500 each year.
The monthly recurring revenue is a total revenue from your paying customers in a month. You can easily calculate it by taking an average subscription payment you get from a total number of such customers. For example, some user pays $100 and the other one – only $20, so an average revenue per user means $60 and MRR totals in $120.
That perfectly works for subscription-based apps. By the way, you not only will know the amount of money you get at some point, but also the statistics of users dropping their plans and upgrading. It gives you benefits in determining areas where your sales fail or have the most potential.
#12. Retention rate

This metric is beneficial as to measuring the effectiveness of your application effectiveness. It shows how many people use an app twice or more within a certain period of time. Why it’s so important? According to the research results presented by Statista, only 24 percent of apps are used more than once within the first half a year after a user installs it.
App retention helps to identify the best platform for your mobile marketing campaign launch. By the way, it highlights the most loyal users that helps you to build more effective targeting campaigns and track in-app purchases by user’s engagement. Not to mention, personalization opportunities when analyzing audience by device, demographics or purchase frequency factors.
Retention rate (RR) is calculated by a specific formula:
RR = ((CE-CN)/CS)) X 100
Where:
CE—customers number at the end of the period;
CN—new customers acquired during the period;
CS—customers number at the start of the period.
You define the “good” retention rate for your application based on your goals and analytics by yourself. Surely, you will look at the average rate in your industry to get the real picture of your app success. The higher your app retention the better for your business growth.
Usually, this metric is used once a new version of an app release on some store. It is essential to see whether your app retention has changed and in what direction.
Conclusion
You can use some of these metrics that are the most applicable to the type of application or all of them in combination which might be a priority. They will give you a clear picture of who and how uses your app, what’s their behavior and preferences, how to not only acquire new users but also retain loyal clientele.
It’s a chance for you to see what’s really going on with your business that might have been hidden from your sight, and use it for the future growth along with getting the most revenue.
Market report

Subscribe


Thank you!
Get ready! You will receive handpicked content right to your inbox.