Transform your data into easy-to-digest formats with our data visualization program. Create dynamic dashboards, track critical KPIs, and make smarter decisions right away.
Transform data into business value
Use cases we emprower
Visualize any part of your business
Sales & Marketing
Operations
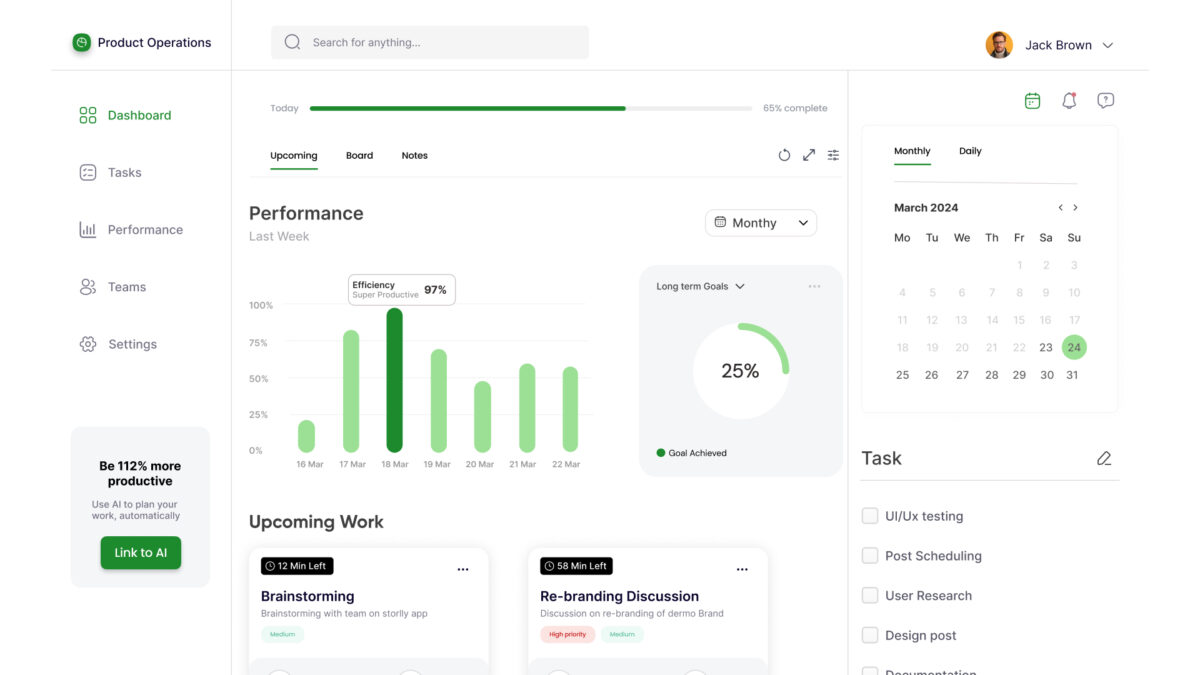
Production & Manufacturing
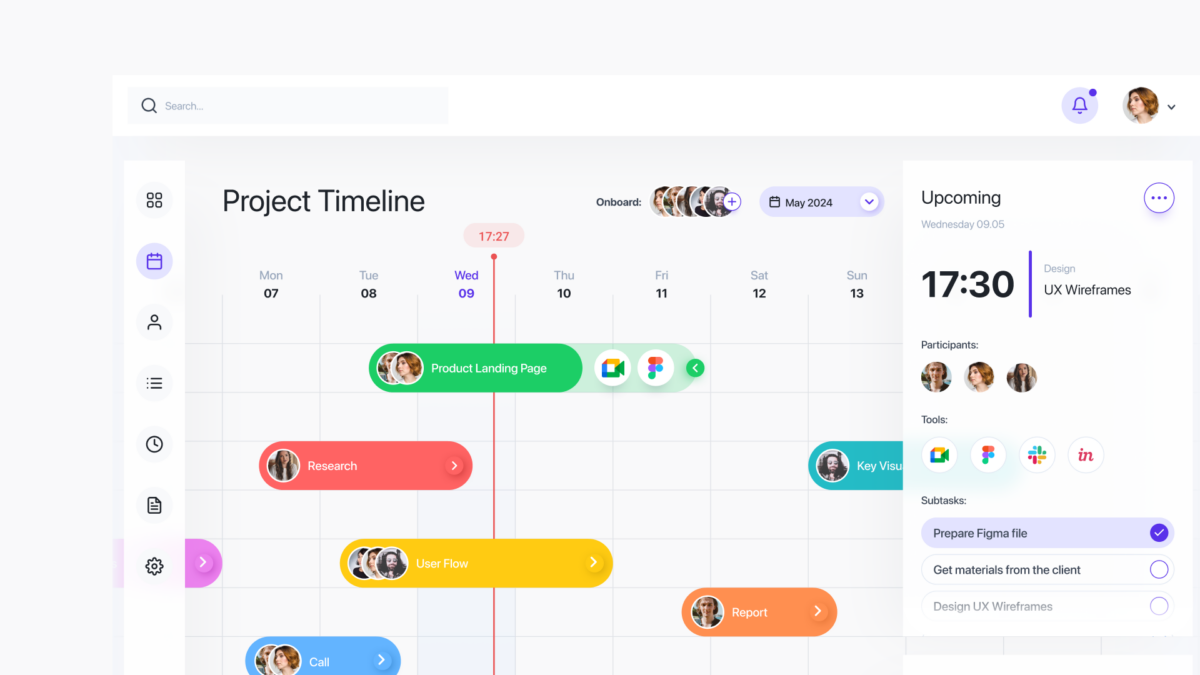
Finance
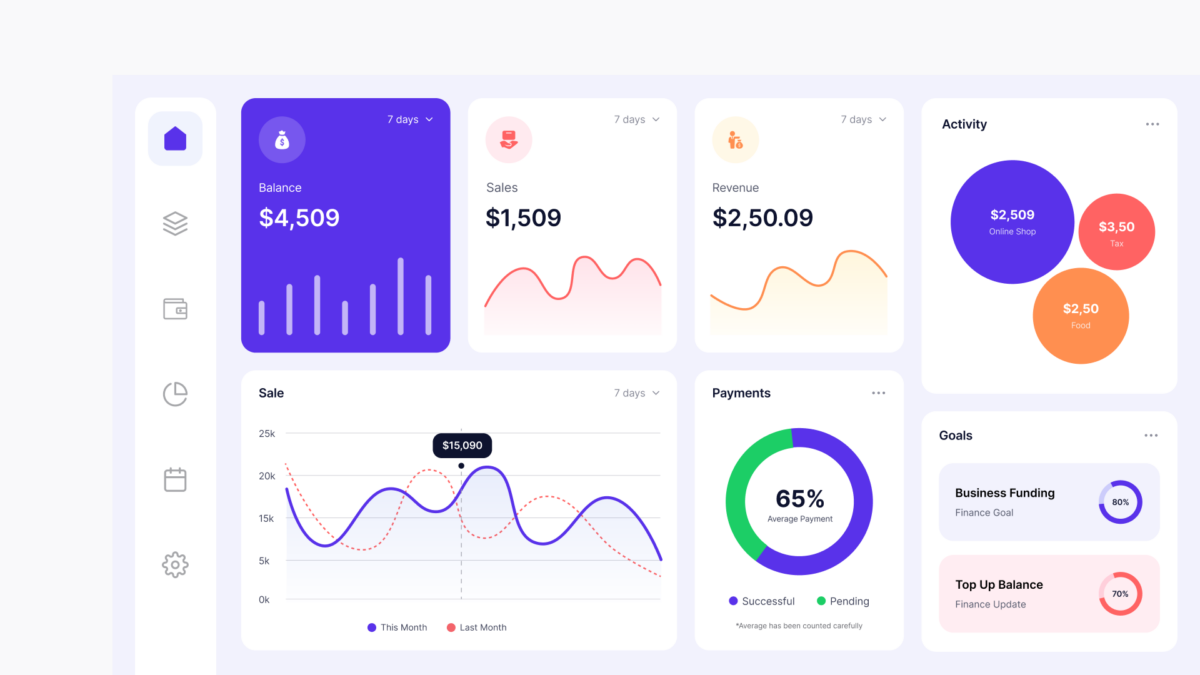
Human Resources
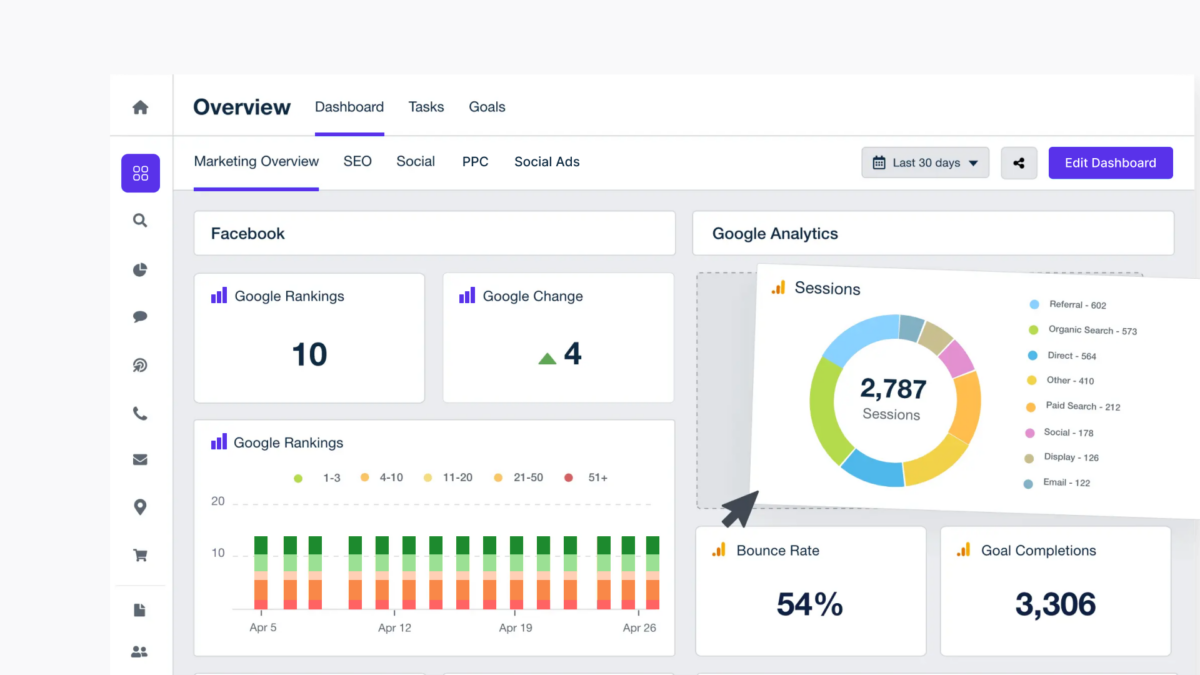


Our data visualization case studies
Research Data Visualization Solution
A comprehensive chemical research data visualization platform that drives scientific breakthroughs by connecting vast datasets in one place.
- Data integration framework for a unified view of information
- Interactive visualizations, including graphs, charts, and heatmaps
- Collaboration and knowledge-sharing tools for researchers
Communication and Data Management Tool
A communication and data management solution for hospitals that streamlines collaboration among healthcare professionals through efficient data sharing and handling.
- Messaging capabilities, including group chats, file sharing, and message encryption
- Centralized data management hub that visualizes patient records, medical histories, and test results
- Collaboration through shared calendars, task assignments, and notifications
- Task management via care plan coordination, progress tracking, and handoff features
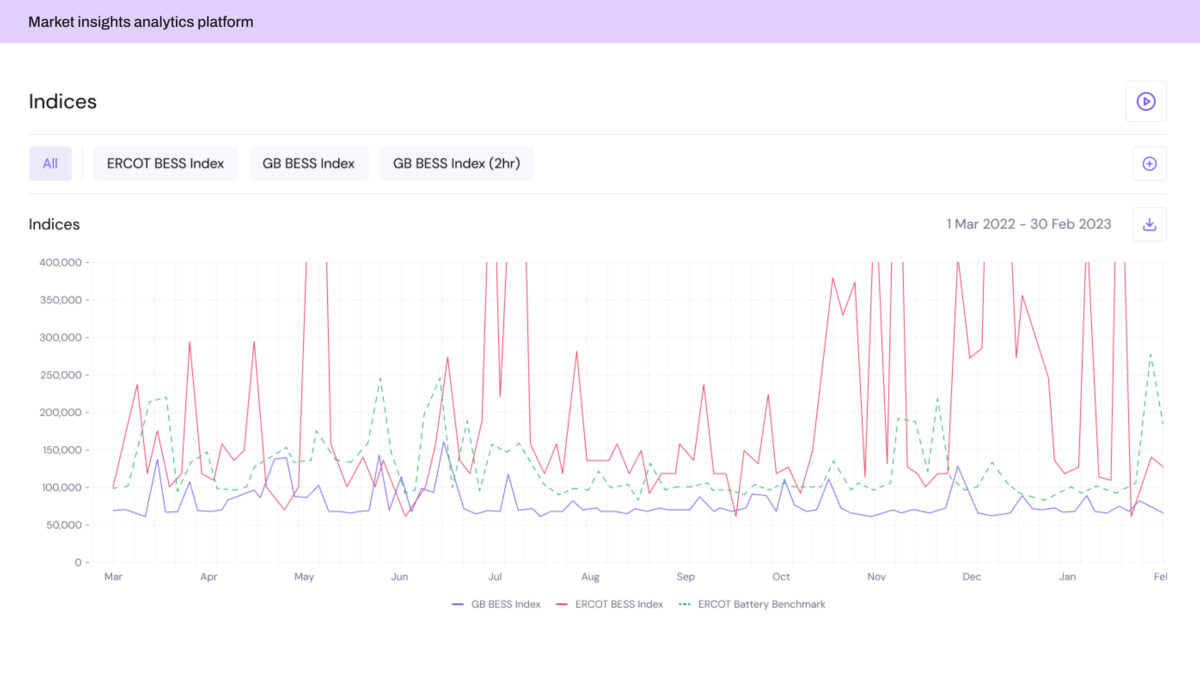
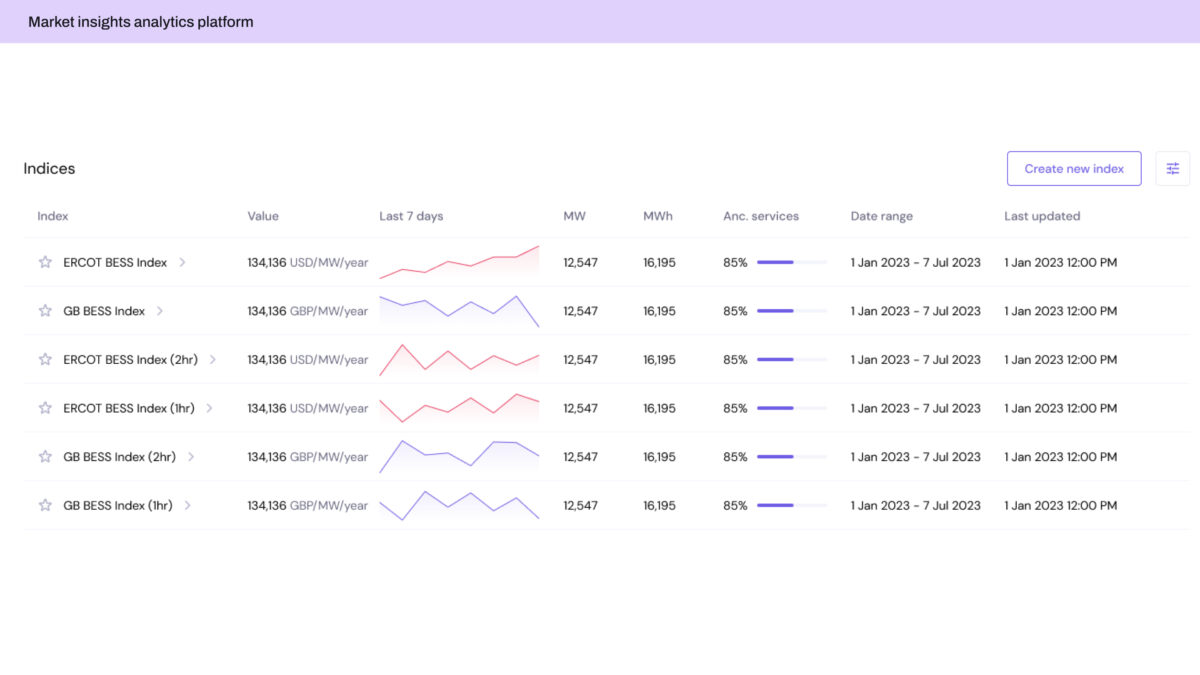
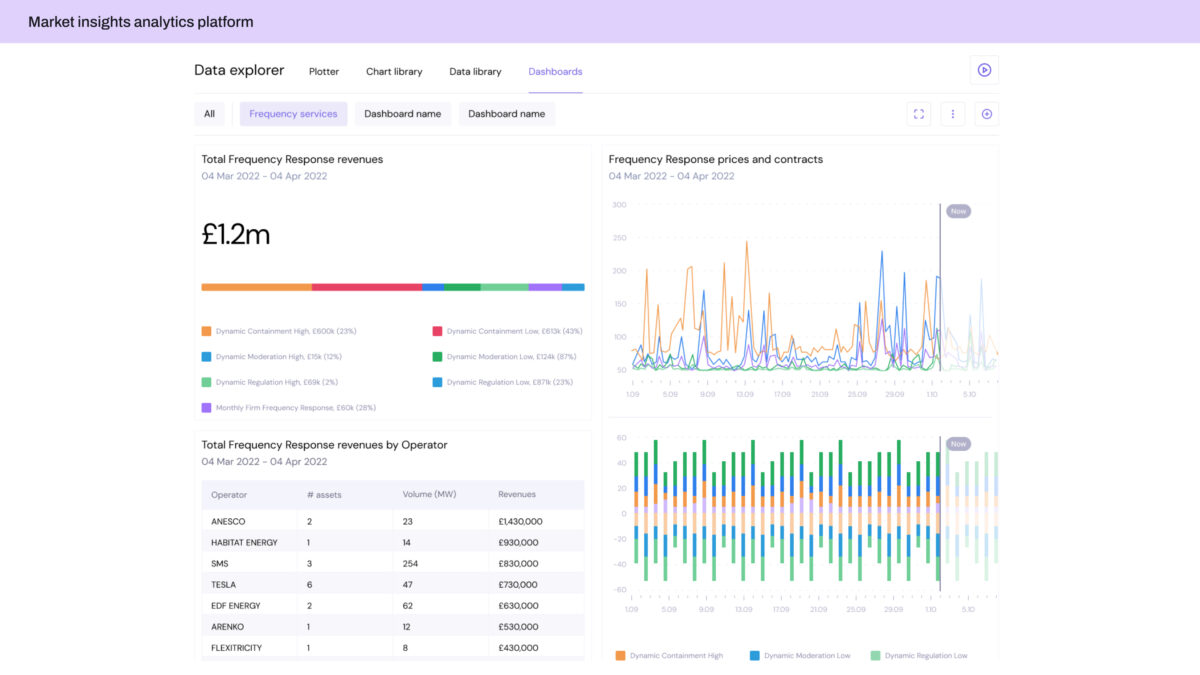
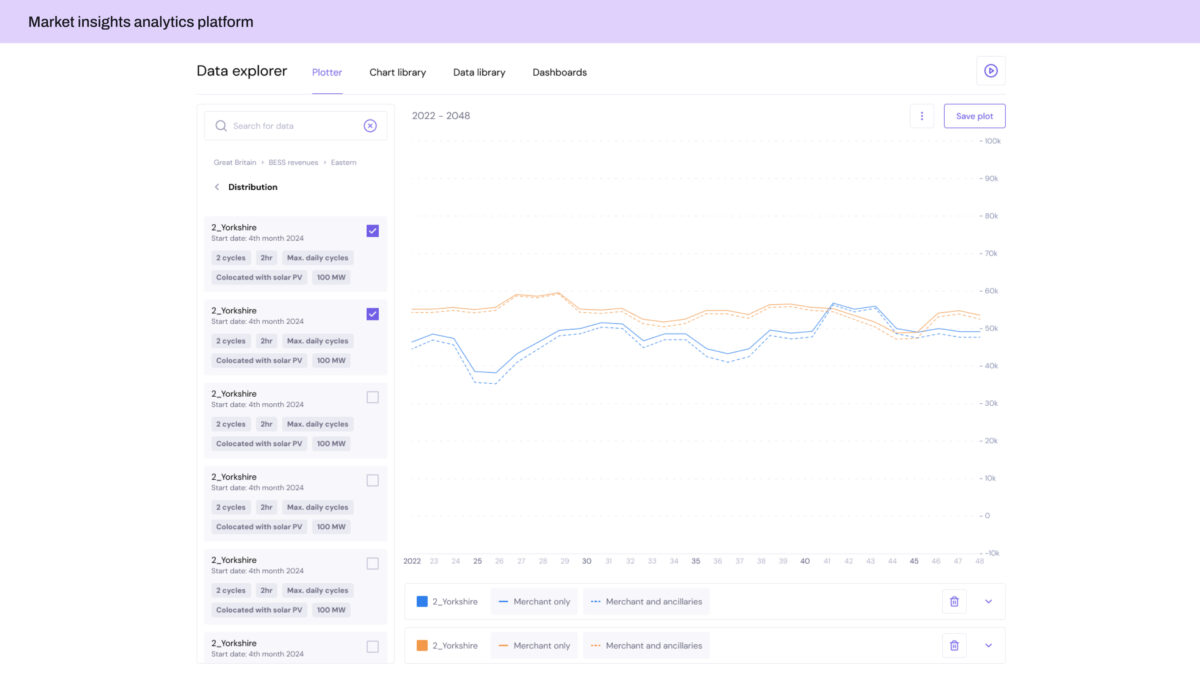
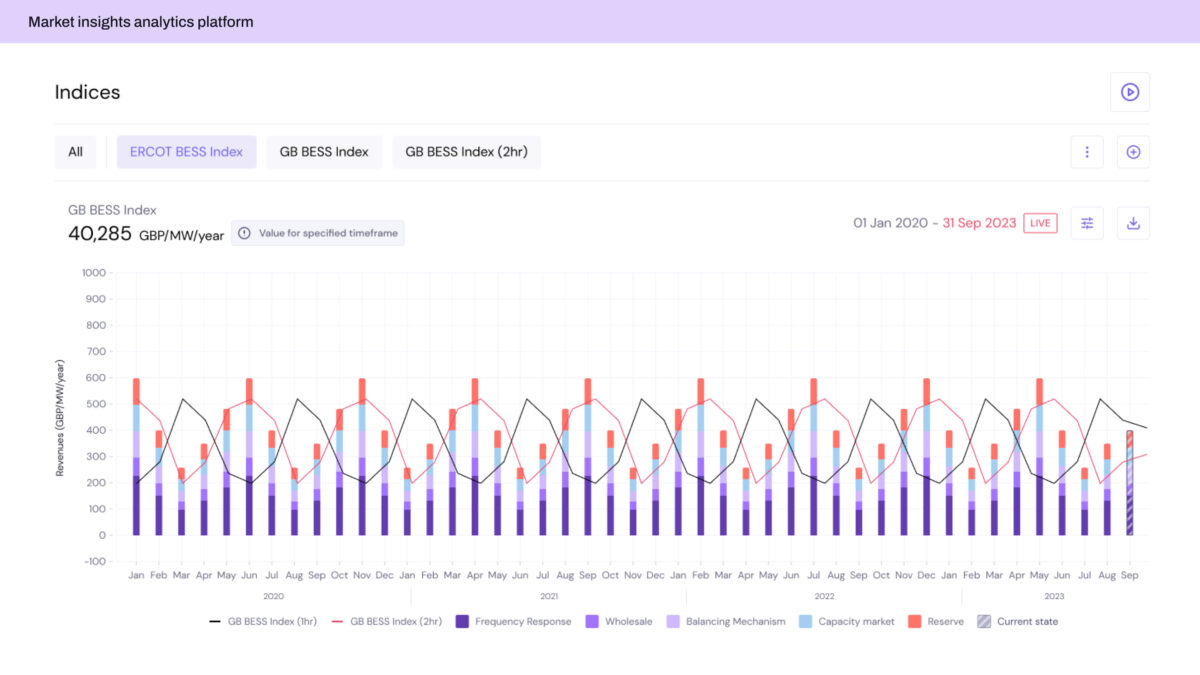
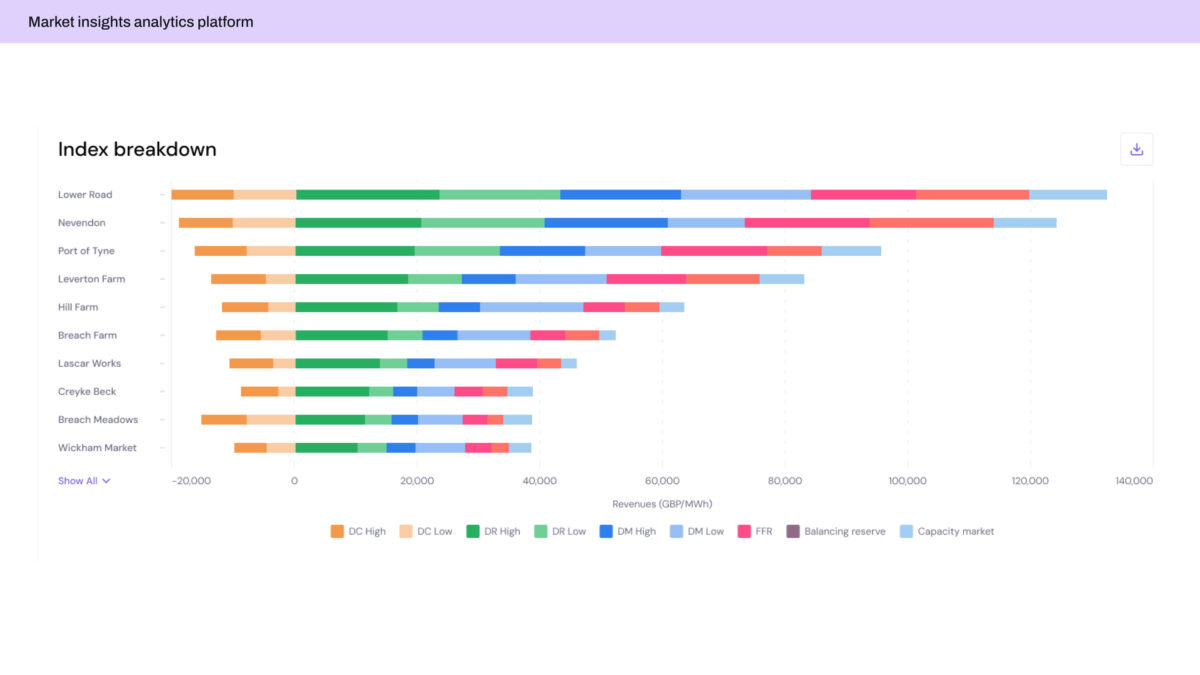
Market Insights Analytics Platform
Finance-focused data visualization software that consolidates diverse data sources and delivers real-time insights for high-stakes trading.
- Automated integration of market reports and trading data
- Standardized data processing for reliability and accuracy
- Information visualizer for trend monitoring and decision-making
- Risk management via comprehensive market analysis
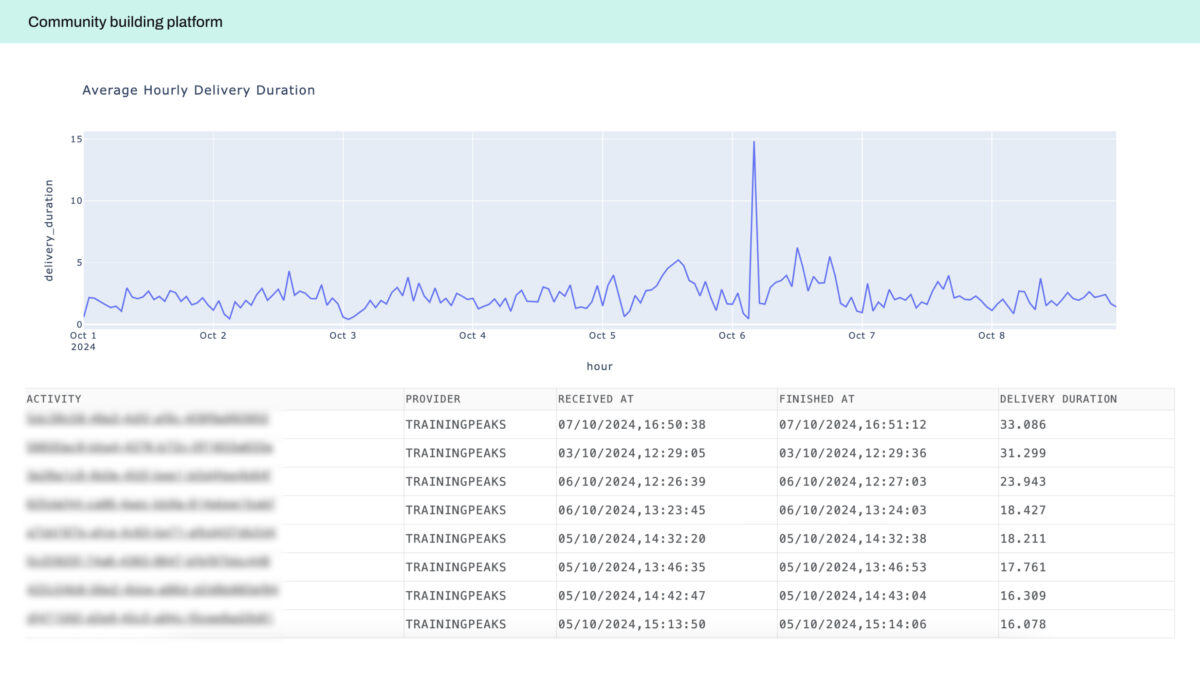
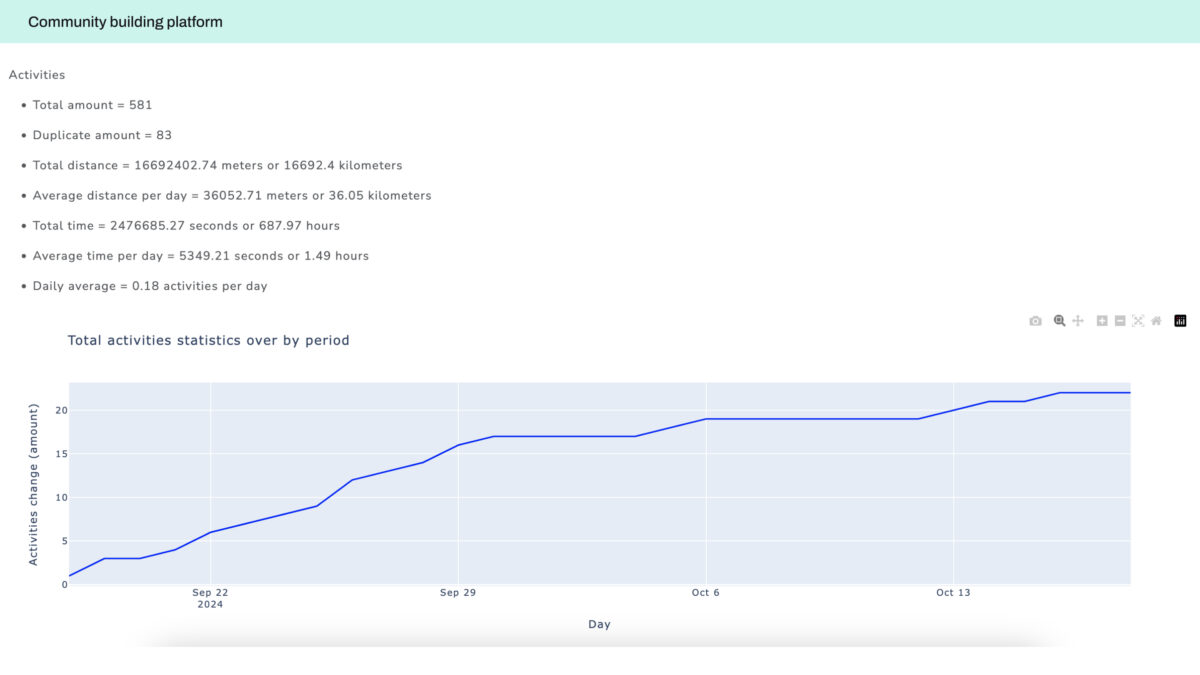
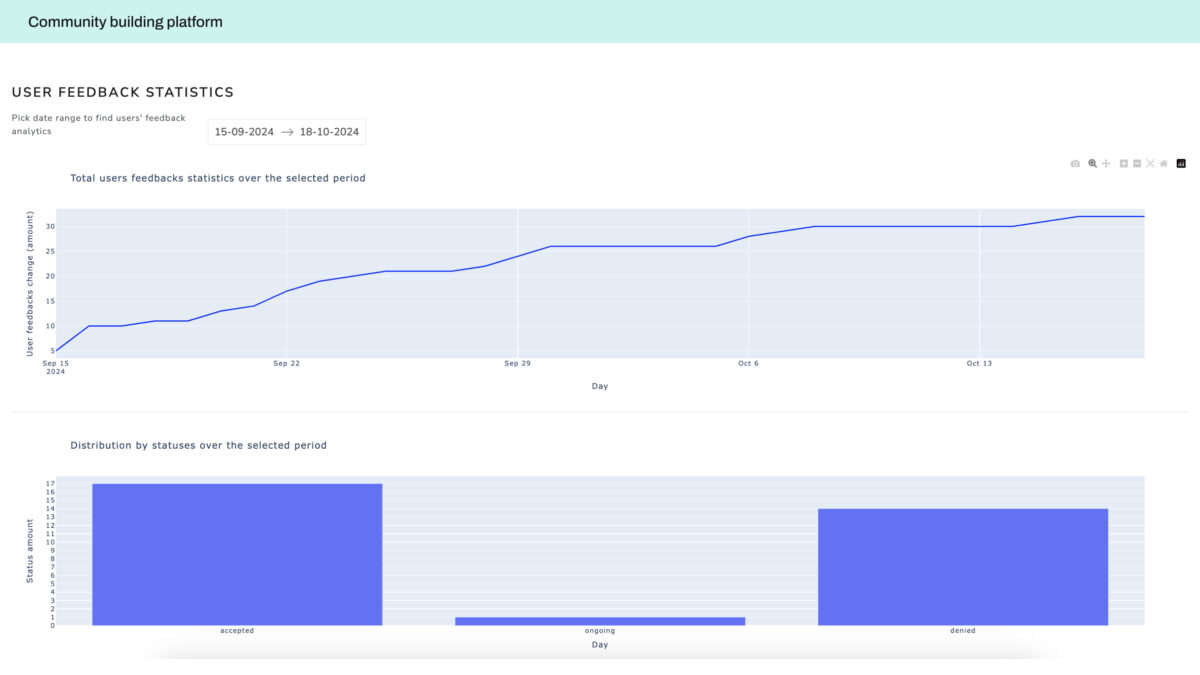
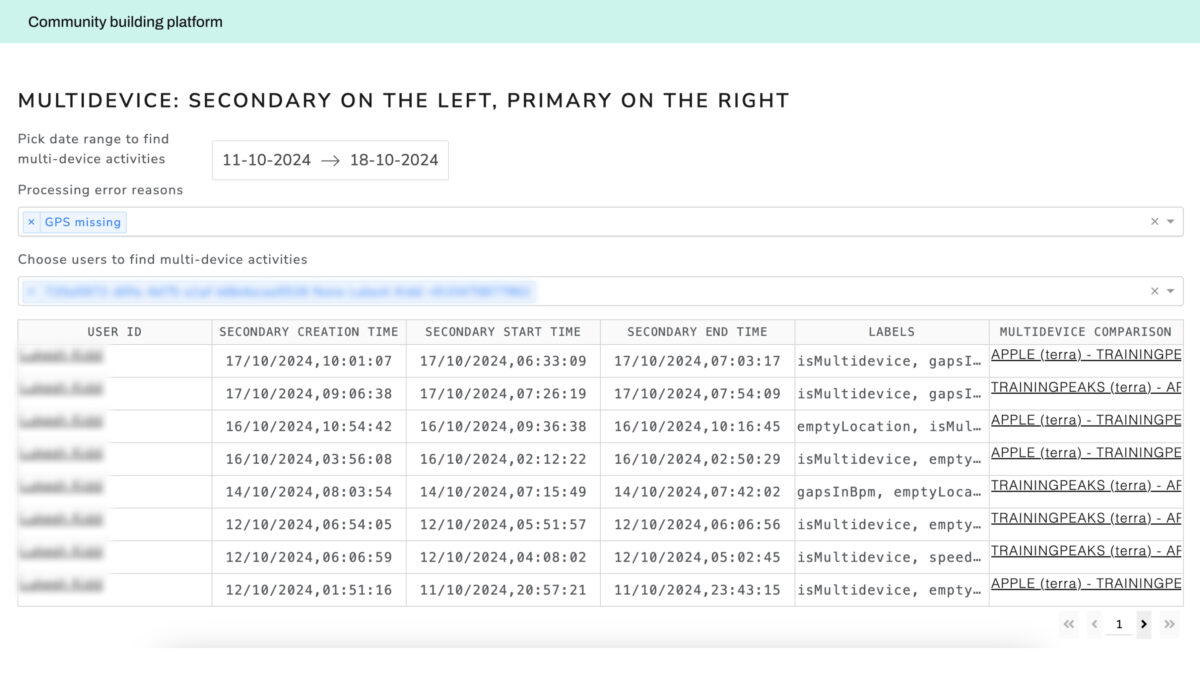
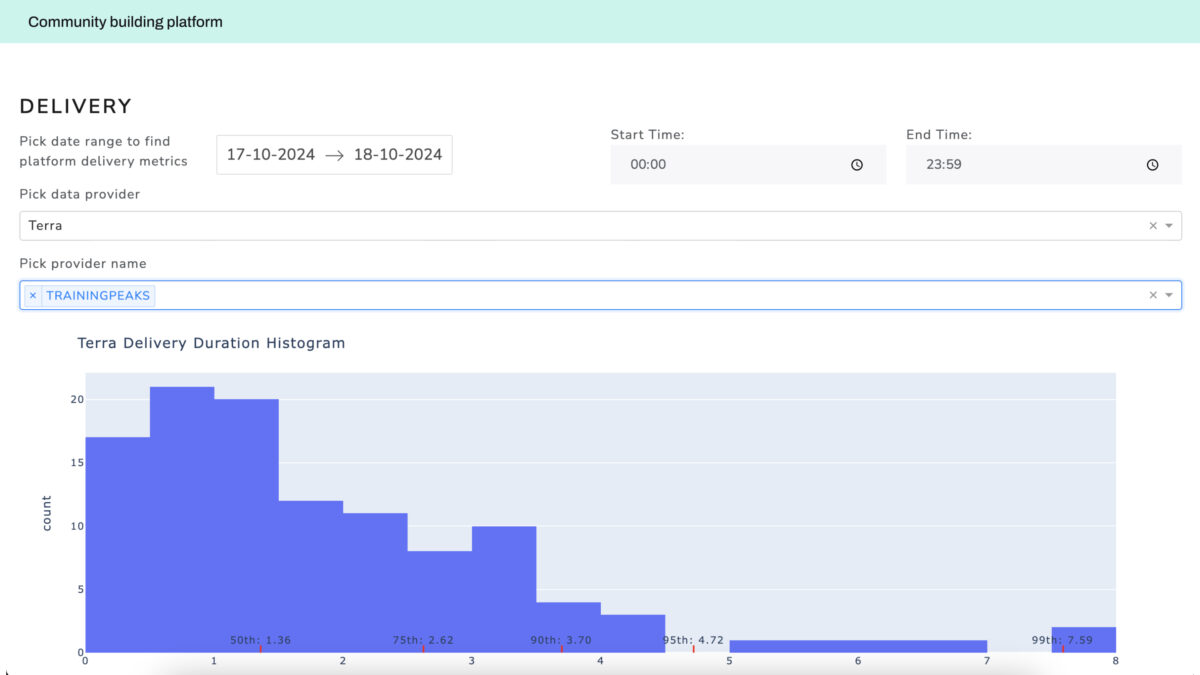
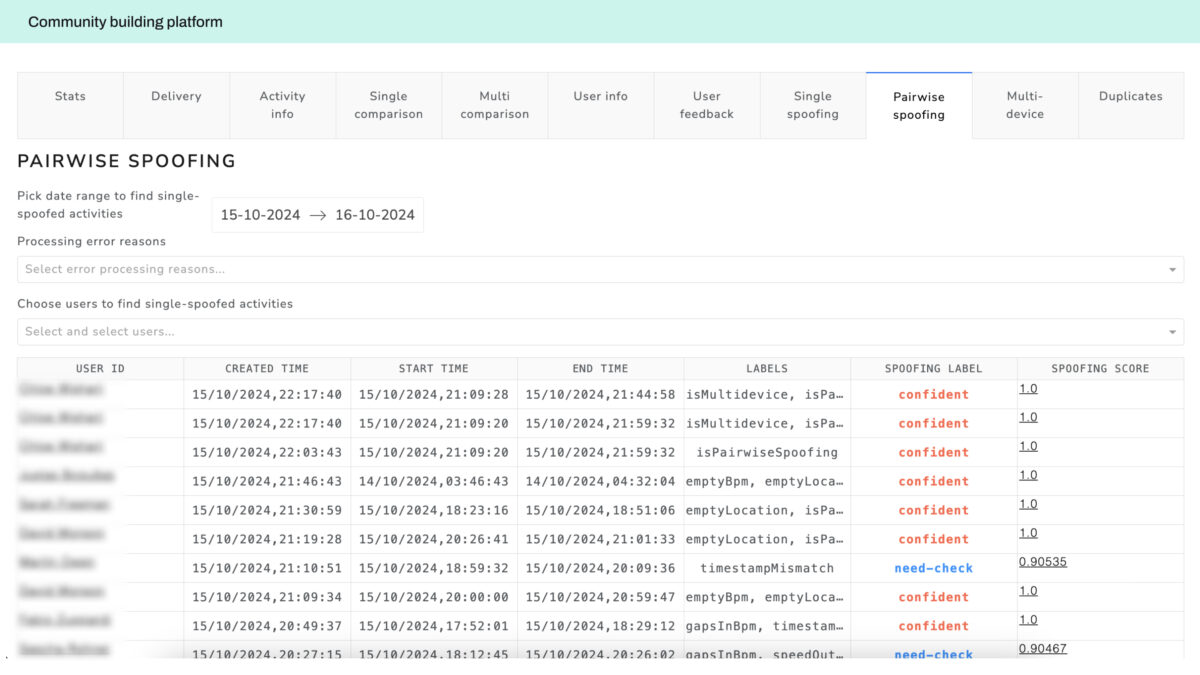
Community Building Platform
An interactive finance community platform and visualization tools that connect fragmented communication channels and user data in an engaging environment.
- User profiles, activity metrics, and gamification integration
- Automated synchronization of data for smooth user interactions
- Centralized platform for increased user loyalty and engagement
- Robust architecture for scalability and ongoing growth support
Get expert consultation on data visualization management

Digital Strategy & Solutions Lead
Designs tools for large data visualization and management that tackle complex business challenges.

Senior AI Architect
Offers expertise in AI platform architecture, LLM/RAG solution design, feasibility studies, data engineering, big-data visualization, and enterprise data management.
Sources
Databases
- Postgres
- Oracle
- MySQL
- BigQuery
- MongoDB
- Redis
Cloud storage
- AWS S3
- Google Cloud Storage
- Azure Blob Storage
SaaS apps
- ERP
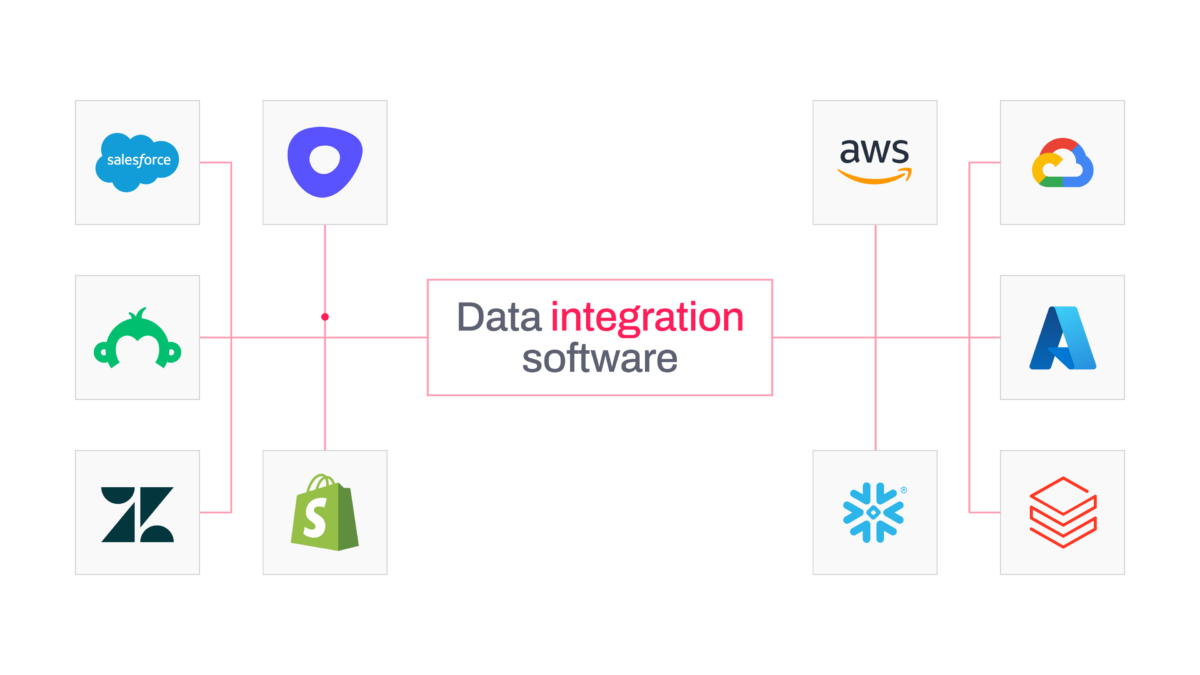
- CRM (Salesforce, Shopify, Zendesk etc)
Analytics tools
- Tableau
- Looker
- Power BI
Big data solutions
- Hadoop
- Apache Spark
Messaging systems
- Kafka
- RabbitMQ
Technologies
ELT platforms
- Airbyte
- Fivetran
- Stitch
Data warehouses
- Snowflake
- Google BigQuery
- Amazon Redshift
Transformation
- dbt (Data Build Tool)
Orchestration
- Apache Airflow
- Prefect
Monitoring
- Grafana
- Datadog
Freaquentle Asked Questions
What are data visualization tools?
Data visualisation tools are software programs that convert raw data sets into visual formats like charts, graphs, and dashboards. These tools make complex information easier to understand and interpret.
What are the examples of data visualization tools?
Most popular examples include data visualisation platforms like Tableau, Power BI, and Looker Studio. You may also leverage custom-built viz tools for specific business needs.
Have you delivered a data visualization service for real-world projects?
Of course! We’ve delivered data visualization applications in various industries, including finance, sales, operations, and beyond. Our visual tools typically feature big data analytics, complex database integrations, and interactive dashboards.
How much does it cost to implement a data visualisation tool?
The cost to implement visualizing tools usually depends on the complexity of your data sets, the features required, and the scale of integration. For an accurate estimate, you can reach out to us for a consultation.
How long does it take to implement a data visualisation platform?
Implementation time varies based on the scope of your database visualisation project. A simple setup might take a few weeks while integrating big data visualization tools could require several months.
Get in touch
Share your ideas, findings, and questions with us. We’re excited to extend our expertise to your project. After form submission, we’ll respond you within 24h.
- Drop us a line:
- Contact us:
