
The company applies genomics and machine learning to research and design chemical producing genetically modified organisms.
In the field of chemical research, harnessing and interpreting complex data is essential for scientific breakthroughs and innovation. This case study explores the collaboration between S-PRO, a leading software development company, and a renowned chemical research organization. The objective of the partnership was to develop a data visualization solution that would enable researchers to unlock valuable insights from their vast datasets, ultimately driving advancements in chemical research.


 FR
FR
 UA
UA
 UK
UK
 US
US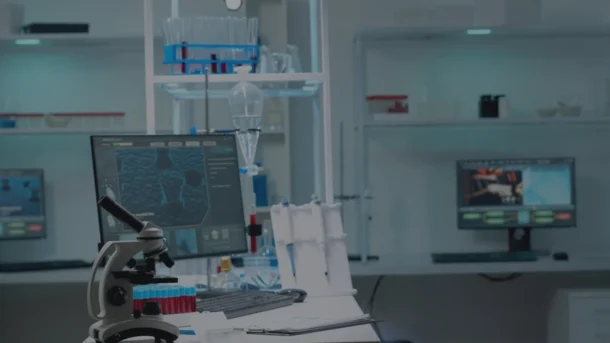


 CH
CH